Computational modeling reveals that a combination of chemotaxis and differential adhesion leads to robust cell sorting during tissue patterning

8Citations
Citations of this article
40Readers
Mendeley users who have this article in their library.

Abstract

Robust tissue patterning is crucial to many processes during development. The "French Flag" model of patterning, whereby naïve cells in a gradient of diffusible morphogen signal adopt different fates due to exposure to different amounts of morphogen concentration, has been the most widely proposed model for tissue patterning. However, recently, using timelapse experiments, cell sorting has been found to be an alternative model for tissue patterning in the zebrafish neural tube. But it remains unclear what the sorting mechanism is. In this article, we used computational modeling to show that two mechanisms, chemotaxis and differential adhesion, are needed for robust cell sorting. We assessed the performance of each of the two mechanisms by quantifying the fraction of correct sorting, the fraction of stable clusters formed after correct sorting, the time needed to achieve correct sorting, and the size variations of the cells having different fates. We found that chemotaxis and differential adhesion confer different advantages to the sorting process. Chemotaxis leads to high fraction of correct sorting as individual cells will either migrate towards or away from the source depending on its cell type. However after the cells have sorted correctly, there is no interaction among cells of the same type to stabilize the sorted boundaries, leading to cell clusters that are unstable. On the other hand, differential adhesion results in low fraction of correct clusters that are more stable. In the absence of morphogen gradient noise, a combination of both chemotaxis and differential adhesion yields cell sorting that is both accurate and robust. However, in the presence of gradient noise, the simple combination of chemotaxis and differential adhesion is insufficient for cell sorting; instead, chemotaxis coupled with delayed differential adhesion is required to yield optimal sorting.

Figures

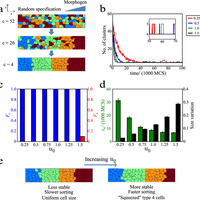
  • Figure 1. Chemotaxis model leads to high fraction of correct sorting but low level of stable sorting. 10 runs were performed for each value of mo. (a) The cell grid at start (top), middle (middle) and end of a run (last). The number of clusters, c, is shown to the left of the grid. Cell boundaries are in dark blue. The morphogen source is located along the rightmost lattice points (x = 142) and diffuses to form a gradient in the x-th (horizontal) direction. The different cell types are colored in light blue (type 1), green (type 2), orange (type 3) and red (type 4). (b) Plot of number of clusters with time for different values of magnitude of chemotactic strength, mo . The number of clusters decreases steadily with time. (Inset) Zoom-in plot of number of clusters between t = 50,000 and 70,000 MCS. (c) Bar graphs of fraction of correct and stable sorting, Fc (blue) and Fs (red), respectively, for different values of mo . For mo ,1.5, none of the runs led to stable sorting. (d) Bar graphs for sorting time, ts, (green) and size variation (black) for different values of mo. Error bars show the standard errors. (e) Summary of findings for low and high mo. doi:10.1371/journal.pone.0109286.g001
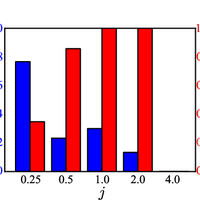
  • Figure 2. Differential adhesion model leads to low fraction of correct sorting but high fraction of stable sorting. 30 runs were performed for each value of j. (a) The cell grid at start (top), middle (middle) and end of a run (last). The number of clusters, c, is shown to the left of the grid. The parameter r~0:025 is used to mimic a low cell fate specification rate. (b) Bar graphs of fraction of correct and stable sorting, Fc (blue) and Fs (red), respectively, for different values of magnitude of differential adhesion, j. For j = 4, none of the runs lead to correct sorting. (c) Bar graphs for sorting time, ts, (green) and size variation (black) for different values of j. Error bars show the standard errors. doi:10.1371/journal.pone.0109286.g002
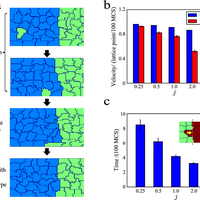
  • Figure 3. Speed of misspecified cells decreases with magnitude of differential adhesion, j. (a) The cell grid as time progresses (top to bottom). (b) Bar graphs showing the speeds of correctly specified (blue) and incorrectly specified cells (red) for different values of j. (c) Bar graph of the merging time for different values of j. (Inset) Cell grid showing the initial configuration of the cells. The average time taken for the centroid of the misspecified to cross the boundary (dotted line in orange) is measured for 100 runs. Error bars show the standard errors. doi:10.1371/journal.pone.0109286.g003
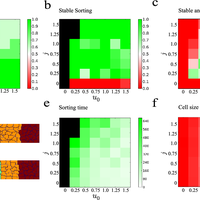
  • Figure 4. Intermediate levels of magnitudes of chemotactic response, mo, and differential adhesion, j, lead to correct and stable sorting with low cell size variations. 10 runs were performed for each value of mo and j. (a–c) Fraction of correct sorting, Fc (a), stable sorting, Fs (b) and fraction of runs that lead to both correct and stable sorting (c) for different combinations of mo and j. (d) Cell grid obtained for intermediate (top) and high j(last). For intermediate j, a few cells are sorted incorrectly. At high j, a larger number of cells are mis-sorted. These mis-sorted cells formed stable clusters with cells of the same fate. (e) Sorting time, ts , for different combinations of mo and j. (Combinations of mo andj with Fc = 0 are shown in black) (b) Cell size variation for different combinations of mo and j. Size variation increases with mo but does not depend on j. doi:10.1371/journal.pone.0109286.g004
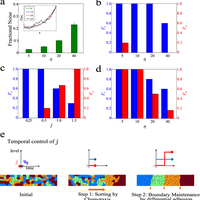
  • Figure 5. Chemotaxis coupled with delayed differential adhesion response yields optimal sorting in presence of noise. (a) Fractional noise in the morphogen gradient for different values of g. (Inset) Representative traces of morphogen concentration, C xð Þ, along x for different values of g. (b) Bar graphs of fraction of correct and stable sorting, Fc (blue) and Fs(red), respectively, for different values of g at mo = 0.75 and j = 0.25. 10 runs were performed for each value of g. (c) Bar graphs of fraction of correct and stable sorting, Fc (blue) and Fs (red), respectively, for different values of jat mo = 0.25 and g = 10. 10 runs were performed for each value of j. (d) Bar graphs of fraction of correct and stable sorting, Fc (blue) and Fs(red) respectively, for different values of g at mo = 0.75 and j = 0 for the first 500 MCS, followed by mo = 0.75 and j = 1.5 for the subsequent 2000 MCS. 10 runs were performed for each value of g. (e) Illustration for the chemotaxis coupled with delayed differential adhesion response model. doi:10.1371/journal.pone.0109286.g005

References Powered by Scopus

Positional information and the spatial pattern of cellular differentiation

2186Citations
N/AReaders
Get full text

Molecular biology - Noise in gene expression: Origins, consequences, and control

1396Citations
N/AReaders
Get full text

Summing up the noise in gene networks

1048Citations
N/AReaders
Get full text

Cited by Powered by Scopus

The many roads to and from multicellularity

45Citations
N/AReaders
Get full text

Zebrafish gastrulation: Putting fate in motion

29Citations
N/AReaders
Get full text

Interplay of mesoscale physics and agent-like behaviors in the parallel evolution of aggregative multicellularity

23Citations
N/AReaders
Get full text

Register to see more suggestions

Mendeley helps you to discover research relevant for your work.

Already have an account?

Cite

CITATION STYLE

APA

Tan, R. Z., & Chiam, K. H. (2014). Computational modeling reveals that a combination of chemotaxis and differential adhesion leads to robust cell sorting during tissue patterning. PLoS ONE, 9(10). https://doi.org/10.1371/journal.pone.0109286

Readers over time

‘14‘15‘16‘17‘18‘19‘20‘21‘22‘23‘24036912

Readers' Seniority

Tooltip

PhD / Post grad / Masters / Doc 15

54%

Researcher 9

32%

Professor / Associate Prof. 4

14%

Readers' Discipline

Tooltip

Agricultural and Biological Sciences 10

40%

Biochemistry, Genetics and Molecular Bi... 6

24%

Physics and Astronomy 5

20%

Engineering 4

16%

Save time finding and organizing research with Mendeley

Sign up for free
0