Performance analysis of electronic structure codes on HPC systems: A case study of SIESTA

12Citations
Citations of this article
46Readers
Mendeley users who have this article in their library.

Abstract

We report on scaling and timing tests of the SIESTA electronic structure code for ab initio molecular dynamics simulations using density-functional theory. The tests are performed on six large-scale supercomputers belonging to the PRACE Tier-0 network with four different architectures: Cray XE6, IBM BlueGene/Q, BullX, and IBM iDataPlex. We employ a systematic strategy for simultaneously testing weak and strong scaling, and propose a measure which is independent of the range of number of cores on which the tests are performed to quantify strong scaling efficiency as a function of simulation size. We find an increase in efficiency with simulation size for all machines, with a qualitatively different curve depending on the supercomputer topology, and discuss the connection of this functional form with weak scaling behaviour. We also analyze the absolute timings obtained in our tests, showing the range of system sizes and cores favourable for different machines. Our results can be employed as a guide both for running SIESTA on parallel architectures, and for executing similar scaling tests of other electronic structure codes. © 2014 Fabiano Corsetti.

Figures

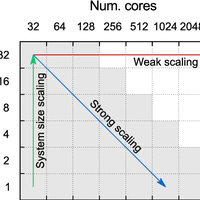
  • Figure 1. Three types of scaling that can be investigated by systematically varying the number of molecules per core and the number of cores. The shaded cells show the suggested set of tests to perform on a typical HPC system. doi:10.1371/journal.pone.0095390.g001
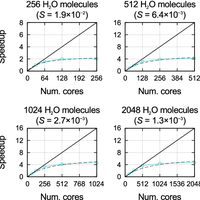
  • Figure 2. Strong scaling on SuperMUC for four different system sizes. The full black lines gives the ideal scaling relative to the smallest system size. The fit to Amdahl’s law is shown by the dashed black line, and the corrsponding S value is given above the plot. doi:10.1371/journal.pone.0095390.g002
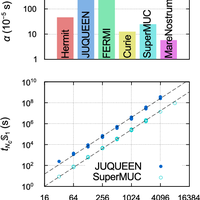
  • Figure 3. Strong scaling and efficiency. Top panel: S value as a function of system size fitted to strong scaling data obtained with SIESTA on the six machines; also included are values calculated with other DFT codes for a single system size on IBM BlueGene architectures (ABINIT: 108 atoms, 1188 electrons, 3D system, 4 k points [42]; VASP: 87 atoms, 822 electrons, 2D system, 14 k points [42]; CPMD: 284 atoms, 1192 electrons, 3D system, k-point sampling unspecified [42]; QE: 1532 atoms, 5232 electrons, 1D system, C point [27,42]; Qbox: 1000 atoms, 12000 electrons, 3D system, C point [11]). Bottom panel: relationship between S and core hour efficiency as a function of the number of cores, for four different values of S given by the black dashed lines, and the fitted values of S obtained with SIESTA on four different machines for a system of 4096 water molecules; the number of cores at which the efficiency is equal to 50% is labelled in each case. doi:10.1371/journal.pone.0095390.g003
  • Figure 4. Absolute timings on the six machines. Top panel: prefactor a for the cubic scaling with system size of the execution time in serial for the self-consistent calculation of the liquid water system (13 SCF iterations). Bottom panel: two examples of the fitting of a to absolute timing data, extrapolated for all number of cores to serial timings using Amdahl’s law and a fitted analytical expression of the strong scaling performance as a function of system size. doi:10.1371/journal.pone.0095390.g004
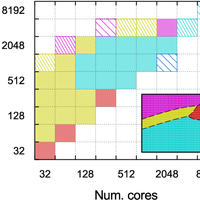
  • Figure 5. Phase diagram of supercomputers. The machine with the lowest execution time is shown for a given system size and number of cores. The colours used are the same as those shown in the top panel of Fig. 4. Boxes with dashed lines indicate that the data for one or more machines is not available; sparse dashed lines indicate that only one machine was run with these parameters. The inset shows the idealized diagram over the same range, using the timing estimates given by the fits of S Nmð Þ and a. doi:10.1371/journal.pone.0095390.g005
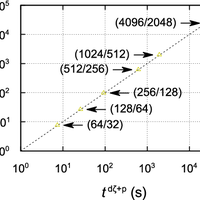
  • Figure 6. Timing comparison on Curie for two different SIESTA basis sets. Each data point plots the execution time of a particular system size simulated with the dfzp basis (23 NAOs/H2O molecule) against that of a different system size simulated with the qfzdp basis (46 NAOs/H2O molecule), chosen so that the two systems have the same total number of basis orbitals. The two system sizes are shown in brackets (dfzp/qfzdp); in each case, both simulations are performed on the same number of cores, equal to the number of molecules in the qfzdp system. doi:10.1371/journal.pone.0095390.g006
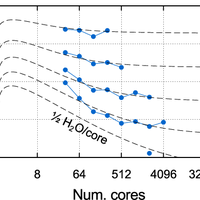
  • Figure 7. Weak scaling on JUQUEEN for different numbers of water molecules per core. The execution time is divided by the square of the number of cores. The dashed lines show the estimates given by the fits of S Nmð Þ and a. doi:10.1371/journal.pone.0095390.g007

References Powered by Scopus

175779Citations
28233Readers
Get full text
100240Citations
15765Readers
Get full text

Register to see more suggestions

Mendeley helps you to discover research relevant for your work.

Already have an account?

Cite

CITATION STYLE

APA

Corsetti, F. (2014). Performance analysis of electronic structure codes on HPC systems: A case study of SIESTA. PLoS ONE, 9(4). https://doi.org/10.1371/journal.pone.0095390

Readers over time

‘14‘15‘16‘17‘18‘19‘20‘21‘22‘23‘24‘25036912

Readers' Seniority

Tooltip

PhD / Post grad / Masters / Doc 16

44%

Researcher 15

42%

Professor / Associate Prof. 5

14%

Readers' Discipline

Tooltip

Physics and Astronomy 13

37%

Chemistry 12

34%

Materials Science 7

20%

Computer Science 3

9%

Save time finding and organizing research with Mendeley

Sign up for free
0