Precision spectral manipulation: A demonstration using a coherent optical memory

0Citations
Citations of this article
17Readers
Mendeley users who have this article in their library.

Abstract

The ability to coherently spectrally manipulate quantum information has the potential to improve qubit rates across quantum channels and find applications in optical quantum computing. Here we present experiments that use a multi-element solenoid combined with the three-level gradient echo memory scheme to perform precision spectral manipulation of optical pulses. If applied in a quantum information network, these operations would enable frequency-based multiplexing of qubits.

Figures

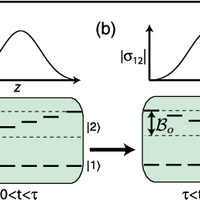
  • FIG. 1. Basic two-level gradient echo memory operation. (a) A pulse with an input Gaussian envelope EiðtÞ, bandwidth Bp, and center frequency !ci enters the storage medium, at time t ¼ 0, where the optical information is stored in the atomic excitation 12. The memory has a linear frequency gradient placed along it in the z direction and a input frequency bandwidth Bi. (b) At time t ¼ , the sign of the frequency gradient is reversed, with the memory output bandwidth Bo ¼ Bi. In this scheme, the echo is emitted at time t ¼ 2 with pulse shape EoðtÞ ¼ Eið tÞ and center frequency !co ¼ !ci.
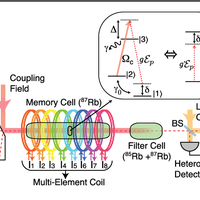
  • FIG. 2. Experimental setup. Probe electric field envelope (Ep), nonpolarizing beam splitter (BS), and I1–I8 currents supplied to the individual solenoids. The inset shows the level scheme and the equivalence between the system used and a two-level atom: one-photon detuning ( ), two-photon detuning ( ), coupling-field Rabi frequency ( c), decay rate from the excited state ( ), decoherence rate between the ground states ( 0), coupling strength between ground and excited states (g), and the effective coupling strength for the equivalent two-level system (g0).
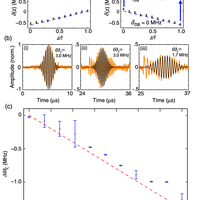
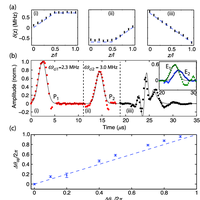
  • FIG. 3. Manipulating pulse frequency. (a) Two-photon detuning as a function of position z along the memory (normalized to length l) due to (i) the input gradient and (ii) output gradients, with minimum and maximum gradient offset os (as noted on figure). The blue (dashed) line corresponds to the desired field, and points correspond to the measured magnetic field. (Error bars are due to the sensitivity of the Gauss meter.) (b) Heterodyne data showing (i) input pulse, (ii) echo for recall with os ¼ 0, and (iii) echo for recall with os ¼ 1400 kHz offset. Orange points correspond to raw data, black lines correspond to modulated Gaussian fit to data, and !c values correspond to the center frequencies of pulses extracted from the fits. (c) The change in the center frequency of the output pulses relative to the input pulse !c as a function of os. Points represent the measured center frequency (error bars are from standard deviation of 100 traces), and the dashed line corresponds to the theoretical behavior.
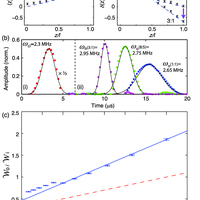
  • FIG. 4. Manipulating pulse bandwidth. (a) Two-photon detuning as a function of position z along the memory (normalized to length l) due to (i) the input gradient and (ii) minimum and maximum output gradients (ratios noted on figure). The blue (dashed) line corresponds to the desired field, and points correspond to the measured magnetic field. (Error bars are due to the sensitivity of the Gauss meter.) (b) Amplitude plot, normalized to the size of the input pulse, showing (i) the input pulse (in red, scaled by a factor of 1=2) and (ii) output pulses recalled with varying output gradients as noted. Points correspond to demodulated data, lines correspond to Gaussian fit to data, and!c values correspond to the center frequencies of pulses relative to the LO. The bracketed ratios indicate o= i. (c) The FWHM of the output pulses W o normalized to the FWHM of the input pulse W i, as a function of input gradient over output gradient j i= oj. Points represent measured FWHM (error bars are from standard deviation of 100 traces), the red (dashed) line corresponds to Eq. (3), and the blue (solid) line corresponds to a numerical simulation, with free parameters: g ¼ 0:066 s 1, 0 ¼ 0, and gN=c ¼ 1000.
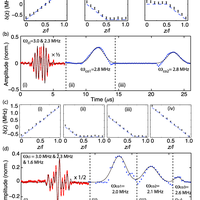
  • FIG. 5. Spectral filtering. (a) Two-photon detuning as a function of position z along the memory (normalized to length l) due to gradients (i)–(iii) corresponding to times (i)–(iii) in (b). For traces (a) and (c) blue (dashed) lines correspond to the desired field, and points correspond to the measured magnetic field. (Error bars are due to the sensitivity of the Gauss meter.) (b) Spectral filtering of (i) a Gaussian envelope containing two frequency components separated by 700 kHz (red, nondemodulated, scaled by 1=2) and the demodulated retrieval (blue) of (ii) higher- and (iii) lower-frequency components averaged over 100 traces. For traces (b) and (d), points correspond to data, lines correspond to fit to data, and !c values correspond to center frequencies of pulses. (c) Two-photon detuning due to (i) input and (ii), (iii), and (iv) output gradients corresponding to times (i)–(iv) in (d), which shows the conversion from the time to the frequency domain of (i) a Gaussian pulse with two modulation sidebands at 700 kHz (red, nondemodulated, scaled by 1=2), and the demodulated retrieval of (ii) the higher-frequency sideband, (iii) the carrier, and (iv) the lower-frequency sideband averaged over 100 traces (blue).
  • FIG. 6. Interference with pulses of different frequencies. (a) Two-photon detuning as a function of position z along the memory (normalized to length l) due to (i)–(ii) input gradients and (iii) the output gradient corresponding to times (i)–(iii) in (b). Blue (dashed) lines correspond to the desired field, and points correspond to the measured magnetic field. (Error bars are due to the sensitivity of the Gauss meter.) (b) Interference of two pulses that are initially time separated, (i) P1 and (ii) P2, shown in red, which are also separated in frequency by 700 kHz. Panel (iii) in (a) shows the superposition of the two pulses. The inset in (b) shows the output from the memory for storage of only a single pulse: P1 recall (E1, green) or P2 recall (E2, blue). Points correspond to demodulated data averaged over 100 traces, lines correspond to Gaussian fit to data, and !c values correspond to center frequencies of pulses. (c) The change in the relative phase of the fitted interference pulse op as a function of the relative phase of the input pulses ip. Points represent data extracted from the fit (error bars are from standard deviation of 100 traces), and the dashed line corresponds to the theoretical behavior.
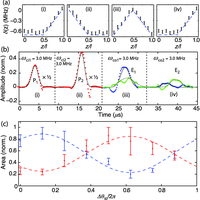
  • FIG. 7. Interference with pulses of the same frequency. (a) Two-photon detuning as a function of position z along the memory (normalized to length l) due to (i)–(ii) input gradients and (iii)–(iv) output gradients corresponding to times (i)–(iv) in (b). Blue (dashed) lines correspond to the desired field, and points correspond to the measured magnetic field. (Error bars are due to the sensitivity of the Gauss meter.) (b) Interference of two pulses, initially time separated, (i) P1 and (ii) P2 (red dashed lines), which have the same center frequency. (iii) Initial E1, and (iv) secondary E2 superpositions of the two pulses. Blue points and solid line correspond to maximum constructive interference for E1, while green crosses and dashed line correspond to maximum constructive interference for E2. Points correspond to demodulated data averaged over 100 traces, lines correspond to the Gaussian fit to the data, and!c values correspond to center frequencies of pulses. (c) The change in area (normalized to the maximum intensity of the individual echoes) as a function of the relative phase of the input pulses ip for (i) E1, and (ii) E2. Points represent data extracted from the fit (error bars are from standard deviation of 100 fits), and the dashed line corresponds to a fit to the data.

References Powered by Scopus

Long-distance quantum communication with atomic ensembles and linear optics

3201Citations
N/AReaders
Get full text

Optical quantum memory

1223Citations
N/AReaders
Get full text

Efficient quantum memory for light

536Citations
N/AReaders
Get full text

Register to see more suggestions

Mendeley helps you to discover research relevant for your work.

Already have an account?

Cite

CITATION STYLE

APA

Sparkes, B. M., Cairns, C., Hosseini, M., Higginbottom, D., Campbell, G. T., Lam, P. K., & Buchler, B. C. (2014). Precision spectral manipulation: A demonstration using a coherent optical memory. In AIP Conference Proceedings (Vol. 1633, pp. 270–272). American Institute of Physics Inc. https://doi.org/10.1063/1.4903159

Readers over time

‘12‘13‘14‘15‘16‘17‘18‘1902468

Readers' Seniority

Tooltip

PhD / Post grad / Masters / Doc 6

50%

Researcher 4

33%

Professor / Associate Prof. 1

8%

Lecturer / Post doc 1

8%

Readers' Discipline

Tooltip

Physics and Astronomy 13

87%

Business, Management and Accounting 1

7%

Earth and Planetary Sciences 1

7%

Save time finding and organizing research with Mendeley

Sign up for free
0