PoCos: Population Covering Locus Sets for Risk Assessment in Complex Diseases

4Citations
Citations of this article
70Readers
Mendeley users who have this article in their library.

Abstract

Susceptibility loci identified by GWAS generally account for a limited fraction of heritability. Predictive models based on identified loci also have modest success in risk assessment and therefore are of limited practical use. Many methods have been developed to overcome these limitations by incorporating prior biological knowledge. However, most of the information utilized by these methods is at the level of genes, limiting analyses to variants that are in or proximate to coding regions. We propose a new method that integrates protein protein interaction (PPI) as well as expression quantitative trait loci (eQTL) data to identify sets of functionally related loci that are collectively associated with a trait of interest. We call such sets of loci “population covering locus sets” (PoCos). The contributions of the proposed approach are three-fold: 1) We consider all possible genotype models for each locus, thereby enabling identification of combinatorial relationships between multiple loci. 2) We develop a framework for the integration of PPI and eQTL into a heterogenous network model, enabling efficient identification of functionally related variants that are associated with the disease. 3) We develop a novel method to integrate the genotypes of multiple loci in a PoCo into a representative genotype to be used in risk assessment. We test the proposed framework in the context of risk assessment for seven complex diseases, type 1 diabetes (T1D), type 2 diabetes (T2D), psoriasis (PS), bipolar disorder (BD), coronary artery disease (CAD), hypertension (HT), and multiple sclerosis (MS). Our results show that the proposed method significantly outperforms individual variant based risk assessment models as well as the state-of-the-art polygenic score. We also show that incorporation of eQTL data improves the performance of identified POCOs in risk assessment. We also assess the biological relevance of PoCos for three diseases that have similar biological mechanisms and identify novel candidate genes. The resulting software is publicly available at http://compbio.case.edu/pocos/.

Figures

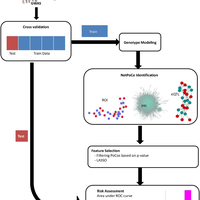
  • Fig 1. The workflow of the proposed method for the identification of PoCos and their utilization in risk assessment.
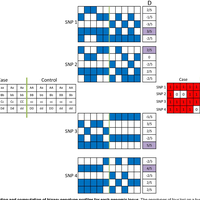
  • Fig 2. Model selection and computation of binary genotype profiles for each genomic locus. The genotypes of four loci on a hypothetical casecontrol dataset are shown on the left. The five possible binary genotype profiles for each locus are computed, as shown in the middle. Blue squares indicate the presence of the genotype of interest in the respective sample for each model (respectively, homozygous minor allele, heterozygous, homozygous major allele, presence of minor allele, presence of major allele). The resulting binary genotype profiles for each locus are shown on the right. Red squares indicate the existence of genotype of interest according to the selected model. In this example, models m(4), m(1), m(5), and m(2) are respectively selected for the four loci.
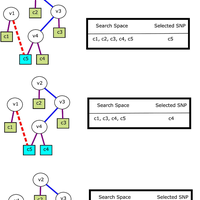
  • Fig 3. Identification of NETPOCOs. Each vi represents a protein (V) and each cj represents a genomic locus (U). Blue edges represent the interactions between proteins (E), purple edges indicate that the respective locus is in the RoI of the coding gene for the respective protein and red edges represent the eQTL links. Initially, P is empty and all loci are considered and the locus (c5) that maximizes δ(.) is added to P. After this point, the search space is restricted to loci that are at most three hops away from c5. We continue this
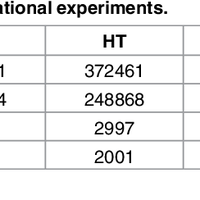
  • Table 1. Genome-Wide Association data used in the computational experiments.
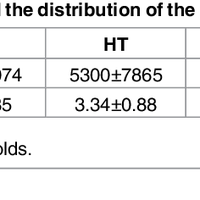
  • Table 2. The number of POCOs identified on each dataset, and the distribution of the genomic loci in each individual POCO.
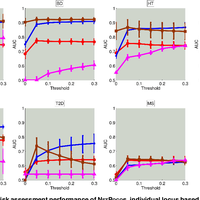
  • Fig 4. Comparison of the risk assessment performance of NETPOCOs, individual locus based features, and polygenic score on seven different diseases. The x-axis shows the p-value threshold (α) used in filtering based feature selection and the y-axis shows the area under the ROC curve (AUC) for performance in risk assessment. The curve shows the average AUC score and error bars show the standard deviation of AUC score across 5 folds in 5 different runs.
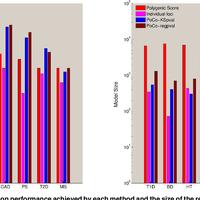
  • Fig 5. The best risk prediction performance achieved by each method and the size of the resulting model for all seven diseases.
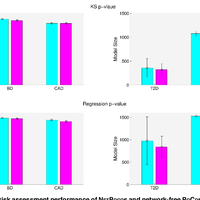
  • Fig 6. Comparison of the risk assessment performance of NETPOCOs and network-free POCOs on T2D, BD and CAD using KS p-value (first row) and regression p-value (second row). The colored bars show the average AUC score and the error bars shows the standard deviation of AUC score across the folds.

References Powered by Scopus

This article is free to access.

This article is free to access.

This article is free to access.

Register to see more suggestions

Mendeley helps you to discover research relevant for your work.

Already have an account?

Cite

CITATION STYLE

APA

Ayati, M., & Koyutürk, M. (2016). PoCos: Population Covering Locus Sets for Risk Assessment in Complex Diseases. PLoS Computational Biology, 12(11). https://doi.org/10.1371/journal.pcbi.1005195

Readers over time

‘16‘17‘18‘19‘20‘21‘22‘23‘24‘250481216

Readers' Seniority

Tooltip

PhD / Post grad / Masters / Doc 24

71%

Researcher 6

18%

Professor / Associate Prof. 4

12%

Readers' Discipline

Tooltip

Medicine and Dentistry 19

56%

Agricultural and Biological Sciences 6

18%

Computer Science 5

15%

Biochemistry, Genetics and Molecular Bi... 4

12%

Save time finding and organizing research with Mendeley

Sign up for free
0