Coupling a Superconducting Quantum Circuit to a Phononic Crystal Defect Cavity

83Citations
Citations of this article
166Readers
Mendeley users who have this article in their library.

Abstract

Connecting nanoscale mechanical resonators to microwave quantum circuits opens new avenues for storing, processing, and transmitting quantum information. In this work, we couple a phononic crystal cavity to a tunable superconducting quantum circuit. By fabricating a one-dimensional periodic pattern in a thin film of lithium niobate and introducing a defect in this artificial lattice, we localize a 6-GHz acoustic resonance to a wavelength-scale volume of less than 1 cubic micron. The strong piezoelectricity of lithium niobate efficiently couples the localized vibrations to the electric field of a widely tunable high-impedance Josephson junction array resonator. We measure a direct phonon-photon coupling rate g/2π≈1.6 MHz and a mechanical quality factor Qm≈3×10⁴, leading to a cooperativity C∼4 when the two modes are tuned into resonance. Our work has direct application to engineering hybrid quantum systems for microwave-to-optical conversion as well as emerging architectures for quantum information processing.

Figures

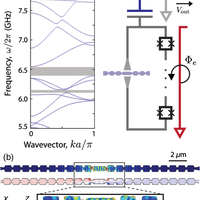
  • FIG. 1. Concept and design. (a) Phononic bands of a LiNbO3 quasi-one-dimensional phononic crystal with lattice constant a ¼ 1 μm, showing the bands of all possible mode polarizations in the range of frequencies relevant to this work. A complete band gap near ν ¼ 6.5 GHz is clearly visible, with a narrower gap also visible below. Other relevant simulation parameters (matching those of the fabricated structures) are the length and width of the connecting struts (320 nm and 240 nm, respectively), the film thickness (224 nm), and the sidewall angle (5°). (b) Deformation uðrÞ and electrostatic potential ϕðrÞ of a mode localized at the defect site, at frequency ν ¼ 6.48 GHz near the center of the band gap. Modes of this polarization can be coupled to electric fields pointing in the direction perpendicular to the crystal lattice. Here, the length and width of the defect are adef ¼ 1.6 μm and wdef ¼ 500 nm, respectively. (c) Schematic of the device, including the drive (or read-out) line (blue) capacitively coupled to the resonator, the flux line (red) used to flux bias the SQUID array, and the electrodes (gray) that couple the circuit to the phononic cavity (light blue). The LiNbO3 crystal axes are indicated.
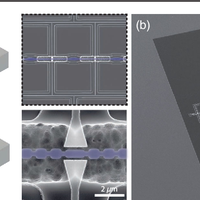
  • FIG. 2. Device fabrication. (a) Schematic of the fabrication process, including (i) electron-beam patterning and argon milling of the phononic nanostructures in the LiNbO3 film, (ii) masked removal of the film from the rest of the substrate, (iii) deposition of all metallization layers, and (iv) masked undercut of the structures. The last step suspends both the phononic cavities and the edge of the coupling electrodes over an etched Si trench. (b) False-colored scanning-electron micrographs of the final device. The charge and flux lines are highlighted in blue and red, respectively. A close-up of the SQUID array clearly shows the Al/AlOx/Al junctions and the trenching in the Si substrate on either side of the array, produced by a deliberate gap between the electron-beam and photolithography masks used to pattern the LiNbO3 film, which results in the Si getting etched twice in those regions. To the left of the SQUID array, a group of six phononic crystal cavities, coupled to the array by 200-nm-thick Al wires, is visible and highlighted by dashed black lines. A close-up of this region shows the LiNbO3 structures (highlighted in blue), including the band-gap regions, the defect site surrounded by the partially suspended aluminum electrodes, and the etched Si trench. The porouslike surface of the etched Si is attributed to micromasking during the XeF2 undercut, but it is likely unimportant as it is located far (> 2 μm) from the region between the electrodes, where the electric fields are strongest.
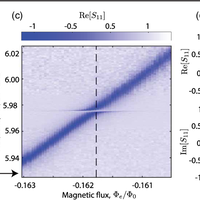
  • FIG. 3. Linear spectroscopy. (a) Reflection spectrum S11ðωÞ of the SQUID-array resonator tuned to a frequency ofωr=2π ¼ 5.90 GHz, including the raw data and the fit to the model (solid lines). The data are normalized to a spectrum collected with a very large probe power (P ¼ 0 dBm, nominal VNA output), where the nonlinear resonance is saturated and absent from the spectrum. At this frequency, we obtain resonator decay rates κ=2π ¼ 11 MHz and κe=2π ¼ 6.3 MHz. (b) Linear spectroscopy of the resonator with varying external flux. The resonance is observed to tunewith the external fluxΦe in the usualway and has amaximum frequencyωr;max=2π ¼ 8.31 GHz. (c)Close-up at the frequency indicated by the black dashed line in the wider tuning plot. An anticrossing of the microwave resonance and a mechanical mode at frequencyωm=2π ¼ 5.9754 GHz is clearly observed, with themechanical feature only visiblewhen the resonator is tuned in close proximity. The data are collected at a higher frequency resolutionwithin a 25-MHz band around themechanical frequency in order to better resolve themechanical mode away from resonance. The value ofΦe at which the twomodes are directly on resonance is marked by a black dashed line. (d) Line cut at the resonance, showing the two dips observed in the reflection spectrum. A least-squares fit (solid black lines) is overlaid with the raw data, showing close agreement with the model.
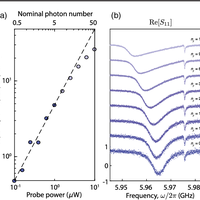
  • FIG. 4. Nonlinear spectroscopy. (a) Frequency shift δωr ≡ ωrðnrÞ − ωrð0Þ of the microwave resonance as a function of the probe tone power (at output from VNA). Since the anharmonicity χ is negative, the resonator redshifts as its occupation nr increases; here, we plot the absolute value of the shift for clarity. As expected from a linearized model of a resonator with a Kerr nonlinearity, the shift has a linear dependence for weak driving strengths (dark blue points), but it deviates from this trend at stronger driving (light blue points). We can calibrate the onresonance occupation nr by fitting δωr to a line in the weak driving regime (dashed black line), using a value of χ=2π ¼ −2.0 MHz for the anharmonicity. (b) Reflection spectra at various values of nr, with the resonator placed to the red side of the mechanical mode. As the occupation increases, the resonator redshifts as expected, while the mechanical mode remains unchanged.
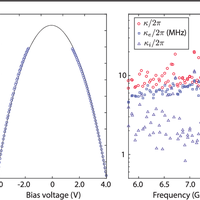
  • FIG. 5. Wide band resonator characterization. Calibration of the external flux as a function of the applied bias voltage (left panel), including data points (circles) and fit to theory. The flux sweet spot at ωr;max ¼ 8.31 GHz lies outside our measurement band. The total, extrinsic, and intrinsic linewidths (κ, κe, and κi, respectively) are also plotted as a function of frequency. A monotonic decrease in κi as the resonator is tuned towards the flux sweet spot may be due to a reduction in the flux noise contribution to the linewidth.
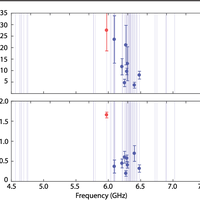
  • FIG. 6. Mechanical spectrum. Quality factorsQm (top panel) and coupling rates g (bottom panel) of various modes are plotted as a function of frequency. The positions of all modes observed in this device are indicated by vertical blue lines, clearly showing that the resonances tend to tightly cluster within certain regions. All of these resonances were verified to be linear in the same way as the mode presented in the main text, ruling out TLS resonances. In both plots, the resonance at ωm=2π ¼ 5.975 GHz presented in the main text is indicated by the red point. The quality factors and coupling rates are obtained through reflection spectra collected at various detunings Δ ¼ ωr − ωm around each mechanical mode and fitted to Eq. (2); error bars indicate the standard deviation of the parameter estimates for these fits.
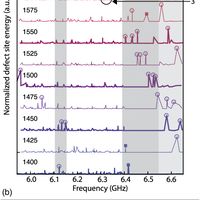
  • FIG. 7. Simulated mechanical spectra. (a) Eigenfrequency simulation results for cavities with defect lengths adef ¼ f1400; 1425;…; 1650g nm. The normalized defect-site energies (which are unitless and range from 0 to 1) are plotted for all the modes in the frequency range 6–6.6 GHz, with the bold lines corresponding to the fabricated defect lengths. The mirror cell design is the same as that used for the band diagram of Fig. 1(a); here, the positions of the complete and partial phononic band gaps are indicated with dark grey and light grey regions. Modes with defect energy greater than 0.3 are considered “localized” and are marked with a circle, and localized modes with the correct polarization are marked with a filled square. We see that as the defect length is increased, several modes shift into the band gap and become localized, but only a small fraction of them have the correct polarization. (b) Electrostatic potential of the three modes labeled in (a), which have distinct profiles and coupling rates. Only modes that have the right polarization and are localized have simulated coupling rates that exceed 1 MHz.
  • FIG. 8. Experimental setup schematic. The sample is placed inside a multilayer magnetic shield [2.5-mm-thick aluminum and 1-mm-thick Cryoperm (MuShield, Inc.)] at the mixing chamber plate of a dilution refrigerator with base temperature T ≈ 7 mK. The measurement and control electronics for probing the scattering parameters and applying a flux bias are illustrated.

References Powered by Scopus

Charge-insensitive qubit design derived from the Cooper pair box

2507Citations
1787Readers
Get full text
Get full text
Get full text

Register to see more suggestions

Mendeley helps you to discover research relevant for your work.

Already have an account?

Cite

CITATION STYLE

APA

Arrangoiz-Arriola, P., Wollack, E. A., Pechal, M., Witmer, J. D., Hill, J. T., & Safavi-Naeini, A. H. (2018). Coupling a Superconducting Quantum Circuit to a Phononic Crystal Defect Cavity. Physical Review X, 8(3). https://doi.org/10.1103/PhysRevX.8.031007

Readers over time

‘18‘19‘20‘21‘22‘23‘24‘25015304560

Readers' Seniority

Tooltip

PhD / Post grad / Masters / Doc 66

63%

Professor / Associate Prof. 19

18%

Researcher 19

18%

Readers' Discipline

Tooltip

Physics and Astronomy 90

78%

Engineering 18

16%

Materials Science 4

3%

Chemistry 4

3%

Save time finding and organizing research with Mendeley

Sign up for free
0